Energy represents one of the largest controllable operating costs for healthcare facilities—typically running $6–12 per square foot annually, or 3–5% of total operating budget for a community hospital. Unlike labor or supply costs, energy expenses are partially within the control of facility management through operational improvements, equipment maintenance, and behavioral interventions. But reducing energy cost requires first understanding where it goes—which is the function of utility metering and energy analytics systems.
Healthcare facility directors who have implemented comprehensive energy metering and analytics consistently identify 10–20% energy cost reduction opportunities that were invisible before granular data was available. The utility bill tells you the total; metering tells you which systems, which buildings, and which time periods are responsible for the largest shares of that total.
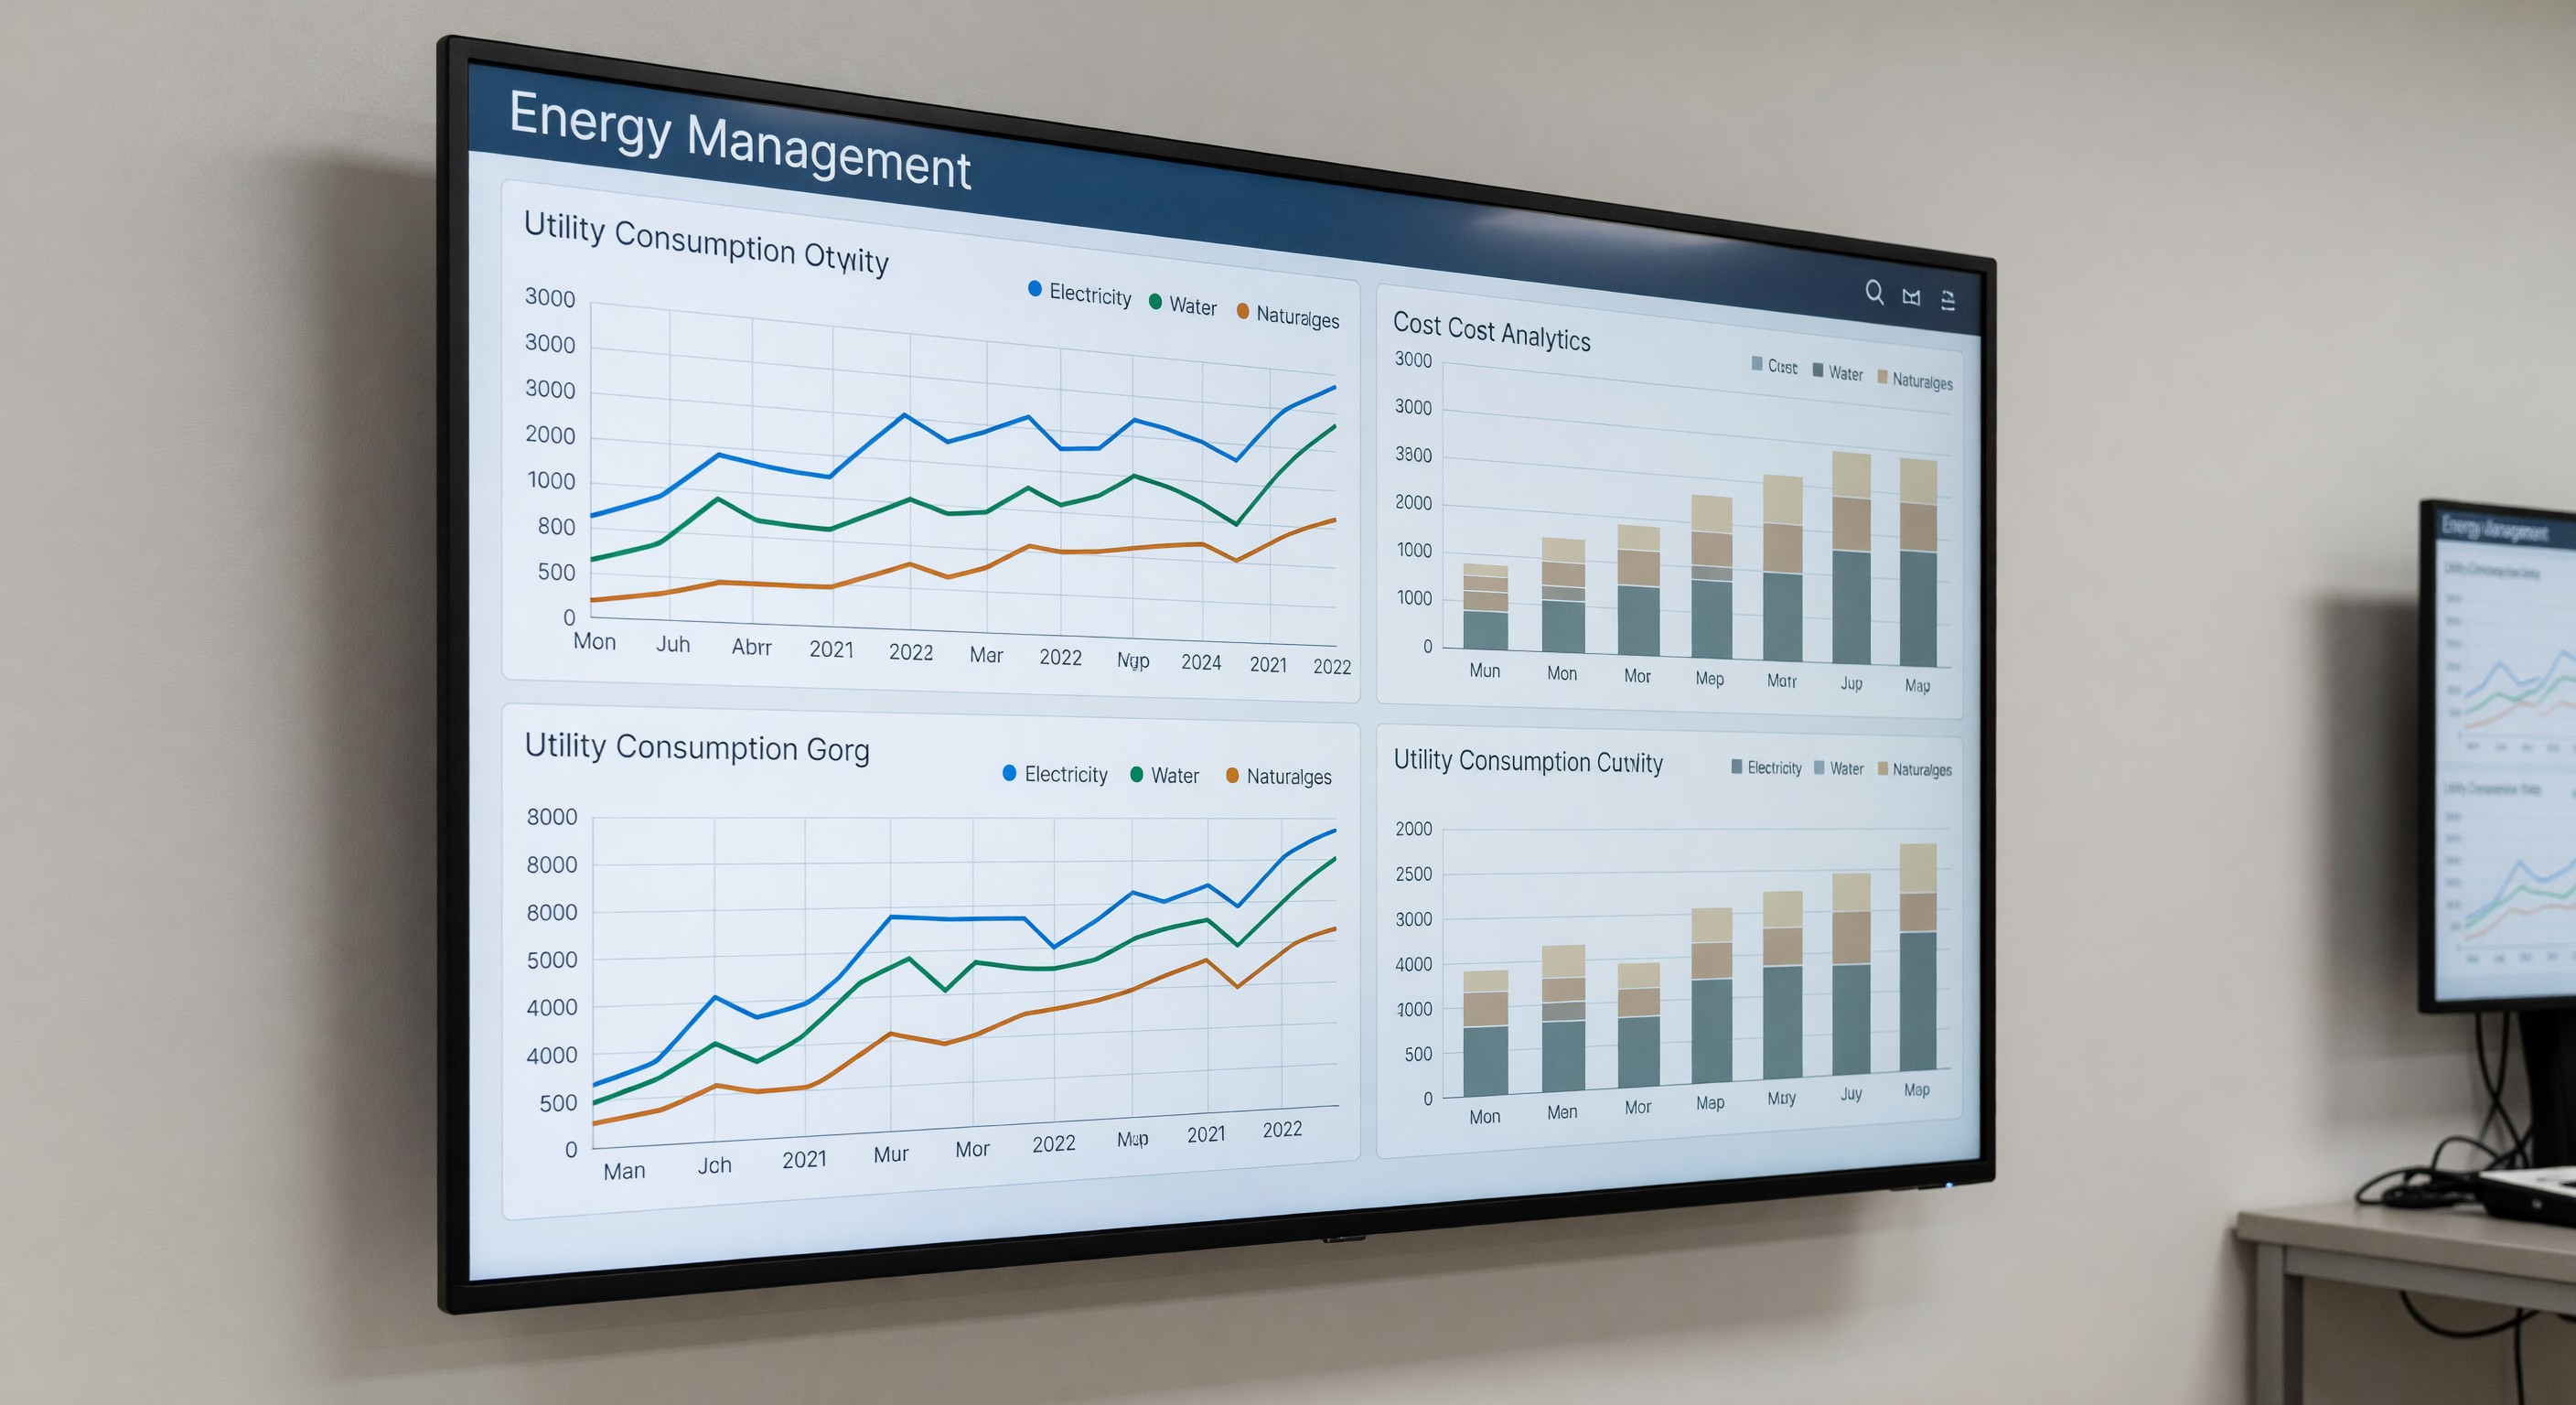
The Energy Metering Hierarchy
Effective healthcare energy analytics requires metering at multiple levels:
Utility-Level Metering The utility meter at the facility service point measures total facility consumption—electricity, natural gas, water—and is the basis for utility billing. This data provides the aggregate picture but no visibility into where energy is consumed within the campus.
Building-Level Submeter Submeters at each building within a multi-building campus allocate total facility consumption to individual buildings. Building-level metering reveals which buildings are performing well versus poorly and allows comparison of similar building types (patient towers, office buildings, research facilities).
System-Level Submeter Submeters at major system levels—the central chilled water plant, the steam plant, the main air handling units, the lighting system—reveal which mechanical systems consume the most energy and where efficiency improvements would have the greatest impact.
End-Use Submeter The most granular level captures energy use by specific end uses—the chiller serving the surgical suite, the AHU serving the ICU, the lighting in a specific wing. End-use metering is expensive to deploy comprehensively but provides the data needed for detailed optimization.
Most healthcare facilities should target building-level and major-system-level submeter coverage at minimum, with end-use submeter in high-consumption areas where intervention opportunities are likely.
Energy Analytics Platform Capabilities
Raw submeter data requires analysis to produce actionable insights. Energy analytics platforms add intelligence to metering data:
Baseline and Benchmarking Energy use intensity (EUI)—energy consumption per square foot per year—is the standard healthcare facility benchmarking metric. EPA’s ENERGY STAR for Healthcare provides benchmarks specific to hospitals, medical offices, and other healthcare building types, calibrated for climate and operational characteristics. Analytics platforms calculate EUI continuously and compare it against portfolio benchmarks and external peer benchmarks.
Anomaly Detection Energy analytics platforms that monitor consumption patterns in real time can detect anomalies—unusual energy spikes, off-hours consumption peaks, consumption that doesn’t correlate with expected demand patterns—that indicate equipment malfunction, control failures, or operational inefficiencies. These anomalies often represent equipment that’s running when it shouldn’t, systems that are fighting each other (heating and cooling systems operating simultaneously), or mechanical failures that increase energy consumption before causing operational failure.
Interval Data Analysis Utility “smart meters” and interval submeters collect data at 15-minute or hourly intervals. This interval data reveals demand peaks that drive utility demand charges, allows identification of optimal load-shifting opportunities, and supports analysis of time-of-use rate structure optimization.
Fault Detection Integration The most sophisticated energy analytics platforms integrate fault detection and diagnostics (FDD) capabilities—correlating energy data with equipment operational data from the BAS to identify specific mechanical faults that are causing energy waste. A stuck damper that’s causing an AHU to run at maximum speed when minimal flow is needed shows up as both an FDD alert and an energy anomaly.
ENERGY STAR for Healthcare Facilities
EPA’s ENERGY STAR program provides healthcare-specific benchmarking through Portfolio Manager—an online tool that calculates EUI and ENERGY STAR scores for healthcare buildings using inputs including annual energy consumption, building area, location, and operational characteristics.
ENERGY STAR Score Hospitals and medical offices with ENERGY STAR scores of 75 or above (meaning they perform better than 75% of similar facilities) are eligible for ENERGY STAR certification—a recognized designation that supports sustainability reporting and marketing.
Benchmarking for Capital Justification ENERGY STAR benchmarking provides the external context needed to justify energy efficiency capital investments. A hospital that benchmarks in the 40th percentile for its climate zone and building type has documented underperformance that creates a compelling case for capital investment in efficiency improvements.
Federal Tax Incentives The ENERGY STAR certification and the Section 179D energy-efficient commercial building deduction (applicable to tax-exempt organizations through direct pay under the Inflation Reduction Act) provide financial incentives for healthcare energy efficiency investments that can offset capital costs.
Implementing a Healthcare Energy Management Program
An effective healthcare energy management program combines metering, analytics, and active management:
Step 1: Baseline Establishment Comprehensive metering across the facility portfolio, integrated with an analytics platform, produces the baseline EUI and identifies the highest-consuming buildings and systems. This baseline is the starting point for all subsequent improvement work.
Step 2: Opportunity Identification Energy audits—conducted at varying depths depending on investment level—identify specific opportunities for improvement. Level 1 audits (walkthrough) identify obvious operational improvements. Level 2 audits (standard) include energy analysis and economic analysis of specific measures. Level 3 audits (investment-grade) provide the detailed analysis needed for major capital project decisions.
Step 3: Implementation and Verification Implement identified improvements, track energy performance through the analytics platform, and verify that implemented measures achieve projected savings. International Performance Measurement and Verification Protocol (IPMVP) provides the methodology for verified savings measurement.
Step 4: Ongoing Monitoring and Optimization Continuous monitoring through the analytics platform maintains performance gains, identifies new opportunities, and prevents performance degradation that would reverse achieved savings without active monitoring.
Frequently Asked Questions
What’s the cost-effectiveness threshold for installing submeters in healthcare facilities? Submeter installation cost-effectiveness depends on the size of the load being metered and the value of the operational intelligence the data provides. Major systems (entire buildings, major mechanical plants) typically justify submetering at any size. Individual equipment submetering is most cost-effective for equipment consuming more than $10,000–$15,000 annually in energy, where operational optimization can yield meaningful savings relative to metering cost.
How does healthcare energy analytics interact with utility demand response programs? Energy analytics platforms that provide real-time visibility into facility electrical demand enable participation in utility demand response programs—where facilities receive payments for reducing load during grid stress events. Analytics help identify which loads can be shed without clinical impact, enabling demand response participation that might otherwise be operationally risky. Many healthcare facilities earn $50,000–$200,000 annually through demand response program participation.
What data should facility directors present to hospital leadership regarding energy performance? Annual energy reports comparing current versus baseline EUI, progress toward sustainability commitments, specific high-ROI opportunities with financial analysis, and peer benchmarking data that contextualizes performance. Energy cost avoidance from completed projects should be tracked and reported as realized financial return on facility investment.
Are there privacy or security concerns with energy metering data in healthcare? Granular energy metering data typically doesn’t contain protected health information and is not subject to HIPAA. However, highly granular occupancy patterns inferred from detailed energy metering could theoretically reveal information about facility operations that organizations might prefer to keep confidential. Standard cybersecurity protections for facility management systems should be applied to energy management platforms.